
Submitted by Abigail Youngman on Tue, 04/03/2025 - 15:45
A new study published in Royal Society Open Science reveals the significant potential of leveraging existing systematic evidence databases to mitigate hazards in the global food system. The research was led by Dr David Willer and Dr Silviu O Petrovan, who are based here at the Department of Zoology, with a team from the Institute for Manufacturing, and Centre for Environment Fisheries and Aquaculture Science.
The work examines how the Conservation Evidence database—originally designed for biodiversity conservation—could be adapted to improve food security and sustainability worldwide.
The global food system, which feeds billions of people, faces an increasing number of threats, from climate change to human-wildlife conflict. The study explores whether existing conservation databases can be used to inform hazard mitigation strategies, offering a systematic, evidence-based approach to addressing food production risks. By focusing on human-wildlife conflict as a case study, the researchers identified gaps and opportunities in the current evidence landscape.
“Our findings highlight that while conservation databases hold valuable insights for food security, significant improvements in tagging, filtering, and integration of non-academic data are needed to make them fully applicable,” said Dr. Willer. “Developing a dedicated food system hazard database could provide a powerful tool for policymakers, farmers, and researchers worldwide.”
The study identifies key challenges, including geographic and taxonomic gaps, inconsistent study methodologies, and the need for broader stakeholder engagement. The researchers recommend enhancing automation, leveraging machine learning, and expanding data sources to create a more comprehensive and accessible food system hazard database.
With food security becoming an increasingly urgent global issue, this research underscores the importance of evidence-based strategies to mitigate risks and build a more resilient food system. The study calls for collaboration among scientists, policymakers, and industry stakeholders to develop a systematic, open-access platform for food hazard management.
Read the full study: Challenges and Opportunities in Leveraging an Existing Systematic Evidence Database for Mitigating Hazards to the Global Food System.
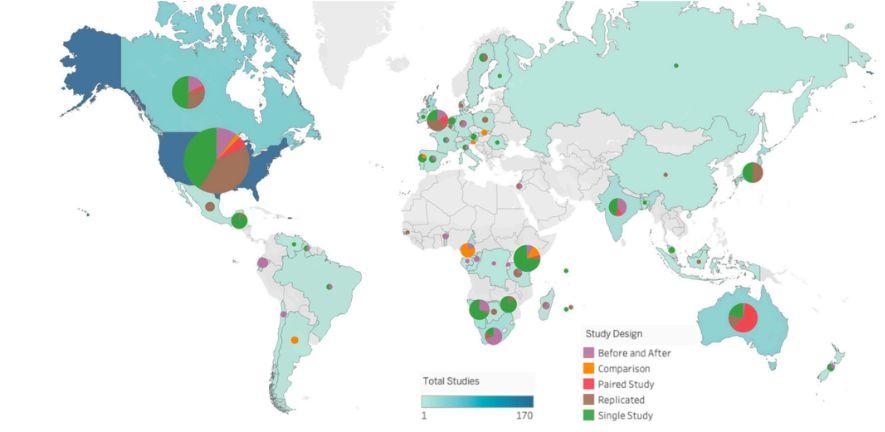
The illustration above, taken from the published paper, shows study designs per country. The colour of each country and the size of their respective pie chart represent the total number of studies on human–wildlife conflict in the country. The colours on the pie charts show the proportion of these studies that fall under each study design category. The sizes of the pies are calibrated against the blue ‘Total Studies’ scale bar.